
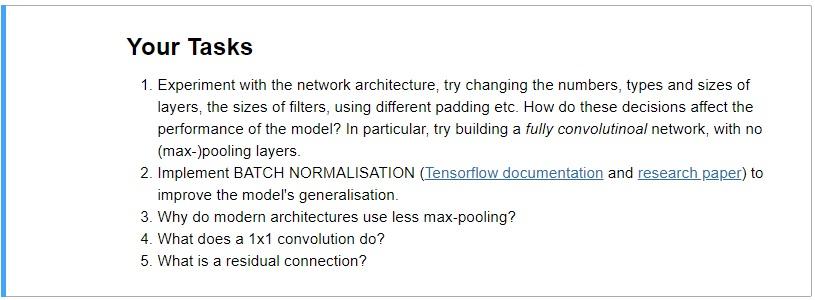
Your Tasks 1. Experiment with the network architecture, try changing the numbers, types and sizes of layers, the sizes of fil

python convolutional neural network Exercise

USE Jupyter Notebook

NB: Please only do Tasks 1-2

We will combine what we’ve learned about convolution, max-pooling and feed-forward layers, to build a ConvNet classifier for images.

Given Code:

in[]from __future__ import absolute_import, division, print_function

# Prerequisits
!pip install pydot_ng
!pip install graphviz
!apt install graphviz > /dev/null

# import statements
import tensorflow as tf
import tensorflow.contrib.eager as tfe
import numpy as np
import matplotlib.pyplot as plt
from IPython import display
%matplotlib inline

# Enable the interactive TensorFlow interface, which is easier to understand as a beginner.
try:
tf.enable_eager_execution()
print(‘Running in Eager mode.’)
except ValueError:
print(‘Already running in Eager mode’)

in[]cifar = tf.keras.datasets.cifar10
(train_images, train_labels), (test_images, test_labels) = cifar.load_data()
cifar_labels = [‘airplane’, ‘automobile’, ‘bird’, ‘cat’, ‘deer’, ‘dog’, ‘frog’, ‘horse’, ‘ship’, ‘truck’]

in[]# Take the last 10000 images from the training set to form a validation set
train_labels = train_labels.squeeze()
validation_images = train_images[-10000:, :, :] validation_labels = train_labels[-10000:] train_images = train_images[:-10000, :, :] train_labels = train_labels[:-10000]

in[]print(‘train_images.shape = {}, data-type = {}’.format(train_images.shape, train_images.dtype))
print(‘train_labels.shape = {}, data-type = {}’.format(train_labels.shape, train_labels.dtype))

print(‘validation_images.shape = {}, data-type = {}’.format(validation_images.shape, validation_images.dtype))
print(‘validation_labels.shape = {}, data-type = {}’.format(validation_labels.shape, validation_labels.dtype))

in[]plt.figure(figsize=(10,10))
for i in range(25):
plt.subplot(5,5,i+1)
plt.xticks([])
plt.yticks([])
plt.grid(‘off’)

in[]# Define the convolutinal part of the model architecture using Keras Layers.
model = tf.keras.models.Sequential([
tf.keras.layers.Conv2D(filters=48, kernel_size=(3, 3), activation=tf.nn.relu, input_shape=(32, 32, 3), padding=’same’),
tf.keras.layers.MaxPooling2D(pool_size=(3, 3)),
tf.keras.layers.Conv2D(filters=128, kernel_size=(3, 3), activation=tf.nn.relu, padding=’same’),
tf.keras.layers.MaxPooling2D(pool_size=(3, 3)),
tf.keras.layers.Conv2D(filters=192, kernel_size=(3, 3), activation=tf.nn.relu, padding=’same’),
tf.keras.layers.Conv2D(filters=128, kernel_size=(3, 3), activation=tf.nn.relu, padding=’same’),
tf.keras.layers.MaxPooling2D(pool_size=(3, 3)),

in[]model.summary()

in[]model.add(tf.keras.layers.Flatten()) # Flatten “squeezes” a 3-D volume down into a single vector.
model.add(tf.keras.layers.Dense(1024, activation=tf.nn.relu))
model.add(tf.keras.layers.Dropout(rate=0.5))
model.add(tf.keras.layers.Dense(1024, activation=tf.nn.relu))
model.add(tf.keras.layers.Dense(10, activation=tf.nn.softmax))

in[]tf.keras.utils.plot_model(model, to_file=’small_lenet.png’, show_shapes=True, show_layer_names=True)
display.display(display.Image(‘small_lenet.png’))

in[]batch_size = 128
num_epochs = 10 # The number of epochs (full passes through the data) to train for

# Compiling the model adds a loss function, optimiser and metrics to track during training
model.compile(optimizer=tf.train.AdamOptimizer(),
loss=tf.keras.losses.sparse_categorical_crossentropy,
metrics=[‘accuracy’])

# The fit function allows you to fit the compiled model to some training data
model.fit(x=train_images,
y=train_labels,
batch_size=batch_size,
epochs=num_epochs,
validation_data=(validation_images, validation_labels.astype(np.float32)))

print(‘Training complete’)

in[]metric_values = model.evaluate(x=test_images, y=test_labels)

print(‘Final TEST performance’)
for metric_value, metric_name in zip(metric_values, model.metrics_names):
print(‘{}: {}’.format(metric_name, metric_value))

in[]img_indices = np.random.randint(0, len(test_images), size=[25])
sample_test_images = test_images[img_indices] sample_test_labels = [cifar_labels[i] for i in test_labels[img_indices].squeeze()]

predictions = model.predict(sample_test_images)
max_prediction = np.argmax(predictions, axis=1)
prediction_probs = np.max(predictions, axis=1)

in[]plt.figure(figsize=(10,10))
for i, (img, prediction, prob, true_label) in enumerate(
zip(sample_test_images, max_prediction, prediction_probs, sample_test_labels)):
plt.subplot(5,5,i+1)
plt.xticks([])
plt.yticks([])
plt.grid(‘off’)

plt.imshow(img)
plt.xlabel(‘{} ({:0.3f})’.format(cifar_labels[prediction], prob))
plt.ylabel(‘{}’.format(true_label))

NB: Please only do Tasks 1-2

Tensorflow documentation: from ‘tensorflow.org’ website: search: tf.keras.layers.BatchNormalization’

research paper: search on web: ‘proceedings.mlr.press/v37/ioffe15.pdf’

Your Tasks 1. Experiment with the network architecture, try changing the numbers, types and sizes of layers, the sizes of fil

NB: Please only do Tasks 1-2

Final Project


Final Project

For the final project, write a paper exploring themes at the intersection of technology and policy. Select one of the following topics:

•  Methods for reducing the level of international cybercrime

•  Coping with the fragility of and lack of security on the Internet

•  Establishing norms of national behavior in cyberspace, in peace and conflict

•  Developing national legal support for norms

•  The role and importance of declaratory national policies for cyberspace

•  Creation of international risk mitigation frameworks

•  Development of strategies that encourage international agreements

•  Assess the risk of catastrophic attacks on national infrastructure.

•  Should cyberspace be treated as a potential battlefield?

•  Explore the impact of commercial cyber-espionage on advanced economies.

•  Contrast European and American approaches to privacy on the Internet.

•  Explore freedom of expression via the Internet within autocratic regimes.

•  Must freedom of speech and association in cyberspace be sacrificed for cybersecurity?

Prepare an 8 – 10 paged paper that fully discusses the policies, events and technology for your selected topic using the brainstorming and analysis methodology. You should use current events, laws/regulations, technology and methods to support your opinion in your paper. You must include at least 5 reference resources. You should include a title page, table of contents, and reference page. Format your paper consistent with APA guidelines.

Nessus Report


VM Scanner Background Report, based on the Nessus Report. As you are writing your report, you may want to refer back to the CEO’s video in Week 1 to make sure your analysis and recommendations align with the CEO’s priorities and concerns.

You should link your analysis to the kinds of organizational functions and data associated with a transportation company (e.g., protecting order data, customer lists, sales leads, Payment Card Industry (PCI) compliance for processing credit, proprietary software, etc.) and provide your recommendation if Mercury USA should purchase the Nessus tool. This report should be four to six pages in length and include a title/cover page. Include in-text citations and a reference page with three quality sources in a citation style of your choice.

Activity to do


Activity 9-2 Avoid needs assessment problems. Some support analysts have expressed the view that the steps in a needs assessment project really should be described as:

1. unbridled euphoria

2. Search for the guilty

3. promotion of the involved

among other things.

Discuss each of these 3 – write 2 paragraphs (of minimum 6 sentences) for each.

blockchain development

 choose one of the Hyperledger design principles described in chapter 2, and explain why your chosen design principle is important to a successfully enterprise blockchain implementation. Then think of three questions you’d like to ask others at the end.

Computer 6

After reading about Business Processes think of a business of your choice. Think of the processes such as: taking an order, filling the order, and receiving payment.

Create a basic flowchart showing the high level steps used. Then create a second flowchart indicating where you would recommend improvements to the processes. Add a short 1 paragraph explanation of why you think your new process is improved.

Optional ideas to create your flowchart include Smart Art in PowerPoint, Word, Excel, or Google drawings/shapes in a Google document or similar software of your choice.

Operations and Buiness performance

 Based on the Harvard Business School Case “Trader Joe’s” prepare a 3-5 page case study analysis.  This paper should follow APA formatting, be double spaced, and include title and reference pages 

https://moodle.ab.edu/pluginfile.php/503404/mod_resource/content/2/TraderJoes.pdf

Exp19_Excel_Ch11_CapAssessment_Deans | Excel Chapter 11 CapAssessment Deans

100% Marked on MYITLAB  

Project Description:

You work for the vice president’s office at a major university. Human Resources provided a list of deans and associate deans, the colleges or schools the represent, and other details. You will use text functions to manipulate text, apply an advanced filter to display selected records, insert database summary statistics, use lookup functions, and display formulas as text.


Start Excel. Download and open   the file named Exp19_Excel_Ch11_CapAssessment_Deans.xlsx. Grader has automatically added   your last name to the beginning of the filename.


First, you want to combine the year and number to create a unique ID.
 

  In cell C8, enter 2006-435 and use Flash Fill to complete the IDs for all the deans and   associate deans.


Next, you want to create a three-character abbreviation for the   college names.
 

  In cell E8, use the text function to display the first three characters of   the college name stored in the previous column. Copy the function to the   range E9:E28.


The college names are hard to read in all capital letters.
 

  In cell F8, insert the correct text function to display the college name in   upper- and lowercase letters. Copy the function to the range F9:F28.


You want to display the names in this format Last, First.
 

  In cell J8, insert either the CONCAT or TEXTJOIN function to combine the last   name, comma and space, and the first name. Copy the function to the range   J9:J28.


Columns K and L combine the office building number and room with the   office phone extension. You want to separate the office extension.
 

  Select the range K8:K28 and convert the text to columns, separating the data   at commas.


You decide to create a criteria area to perform an advanced filter   soon.
 

  Copy the range A7:M7 and paste it starting in cell A30. Enter the criterion Associate Dean in   the appropriate cell on row 31.


Now you are ready to perform the advanced filter.
 

  Perform an advanced filter using the range A7:M28 as the data source, the   criteria range you just created, and copying the records to the output area   A34:M34.


The top-right section of the worksheet contains a summary area. You   will insert database functions to provide summary details about the Associate   Deans.
 

  In cell L2, insert the database function to calculate the average salary for   Associate Deans.


In cell L3, insert the database function to display the lowest salary   for Associate Deans.


In cell L4, insert the database function to display the highest   salary for Associate Deans.


Finally, you want to calculate the total salaries for Associate   Deans.
 

  In cell L5, insert the database function to calculate the total salary for   Associate Deans. 


Format the range L2:L5 with Accounting Number Format with zero   decimal places.


The range G1:H5 is designed to be able to enter an ID to look up that   person’s last name and salary.
 

  In cell H3, insert the MATCH function to look up the ID stored in cell H2,   compare it to the IDs in the range C8:C28, and return the position number.


Now that you have identified the location of the ID, you can identify   the person’s last name and salary.
 

  In cell H4, insert the INDEX function. Use the position number stored in cell   H3, the range C8:M28 for the array, and the correct column number within the   range. Use mixed references to keep the row numbers from changing. Copy the   function to cell H5 but preserve formatting. In cell H5, edit the column   number to display the salary.


In cell D2, insert the function to display the formula stored in cell   F8.
  In cell D3, insert the function to display the formula stored in cell H3.
  In cell D4, insert the function to display the formula stored in cell H4.
  In cell D5, insert the function to display the formula stored in cell L3.


Create a footer with your name on the left side, the sheet name code   in the center, and the file name code on the right side.


Save and close Exp19_Excel_Ch11_CapAssessment_Deans.xlsx.   Exit Excel. Submit the file as directed.