Data Mininig


Provide a reflection of at least 500 words (or 2 pages double spaced) of how the knowledge, skills, or theories of this course(introduction to data mining) have been applied or could be applied, in a practical manner to your current work environment. If you are not currently working, share times when you have or could observe these theories and knowledge could be applied to an employment opportunity in your field of study.

Requirements:

  • Provide a 500 word (or 2 pages double spaced) minimum reflection.
  • Use of proper APA formatting
  • Share a personal connection that identifies specific knowledge and theories from this course.
  • Demonstrate a connection to your current work environment. If you are not employed, demonstrate a connection to your desired work environment.
  • You should NOT provide an overview of the assignments assigned in the course. The assignment asks that you reflect how the knowledge and skills obtained through meeting course objectives were applied or could be applied in the workplace.

BI_Discussion_2

Discuss the process that generates the power of AI and discuss the differences between machine learning and deep learning.

Response should be 150-250 words and must be 2 APA formatted reference.

InfoTech Import in Strat Plan (ITS-831)

Course name: InfoTech Import in Strat Plan (ITS-831)

Discussion Topic: Physical Security

Word Count: 300+ words

Discuss an organization’s need for physical security. What methods, approaches, and models can be used by organizations when designing physical security needs? Lastly, explain how these security measures will safeguard the organization.

Provide an outside source that applies to the topic, along with additional information about the topic or the source (please cite properly in APA)

At least one scholarly source should be used in the discussion. Be sure to use information from your readings and other sources. Use proper citations and references in your post.

Reading resources:

Chapter 7, “Security”. Managing and Using Information Systems, Keri E. Pearlson, Carol S. Saunders, Dennis F. Galletta, John Wiley & Sons 

Chapter 7, “Security”. Khelf, R., & G-Z, N. (2018). IPsec/Firewall Security Policy Analysis: A Survey. 2018 International Conference on Signal, Image, Vision, and Their Applications (SIVA), 1. Retrieved from https://doi.org/10.1109/SIVA.2018.8660973

plagiarism check required, Good work, APA format, within 8hrs

practical connection paper on cloud computing

Develop a paper describing how the knowledge, skills or theories of this course (cloud computing) have been applied or could be applied, in a practical manner to your current work environment as an IT consultant working for an organization of your choice.

(topics eg: understanding cloud comp types, cloud services models, saas, paas, iaas.

Requirements: 

Provide a 500-word (2 pages). 

APA format.

Assignment

 Discussion #1: What is an artificial neural network and for what types of problems can it be used? Discussion #2: Compare artificial and biological neural networks. What aspects of biological networks are not mimicked by artificial ones? What aspects are similar? 

Discussion #3:  What is the relationship between Naïve Bayes and Bayesian networks? What is the process of developing a Bayesian networks model?

Note: Your response should be 250-300 words for each question.  Respond to two postings provided by your classmates.
There must be at least one APA formatted reference (and APA in-text citation) to support the thoughts in the post.  Do not use direct quotes, rather rephrase the author’s words and continue to use in-text citations. 

ITSD324:Project Testing and Software Quality Assurance


Assignment Description

Automation testing is an important task that will help you reduce the time it takes to execute a test case. In this assignment, you will install a trial version of an automation testing tool and then create automation test cases.
The automation testing process includes the following stages:

  • Select the appropriate tool.
  • Determine the test cases that should be automated.
  • Implement the automated test cases.
  • Record the test script.
  • Save the test script.
  • Execute and analyze the test results.

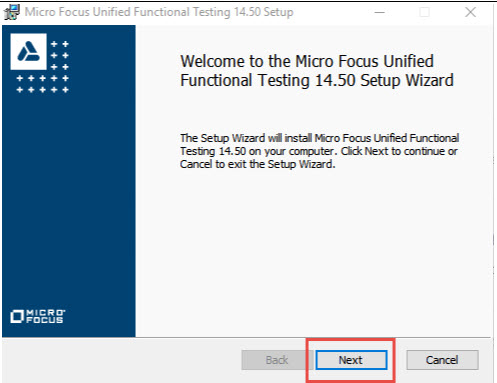
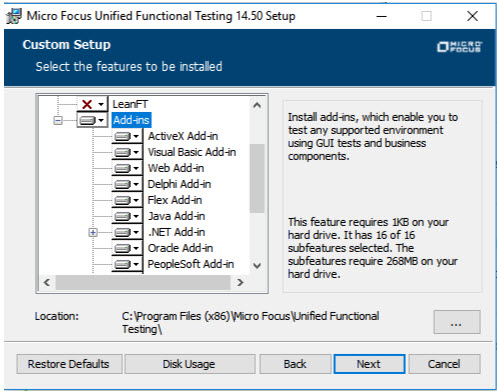
Please follow the step-by-step instructions and screenshots below to install the tool (Micro Focus, 2018):

  • Step 1: Use the search engine, and search for Unified Functional Testing Trial Version.
  • Step 2: The browser will take you to the Microfocus site.
  • Step 3: Enter all details and click “Free Trial.”
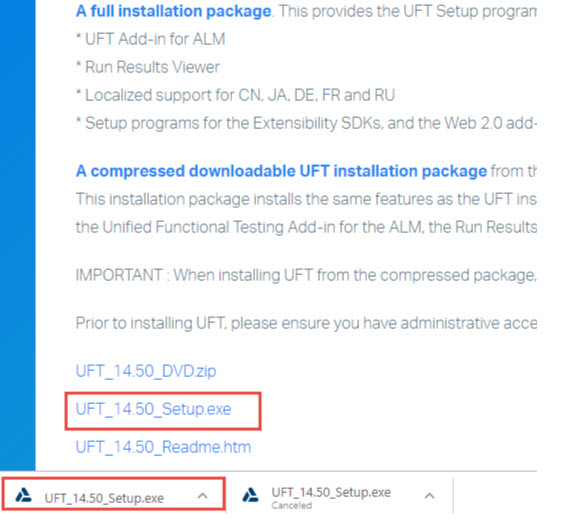
  • Step 4: Go to “All Products,” and click the UFT Download button.


  • Step 5: Click on the UFT Version_SetUp.exe file.
  • Step 6: It will take at least 10 minutes to download the .exe file.
  • Step 7: Click on the .exe file.

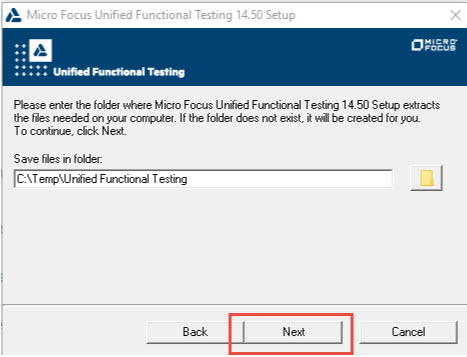
  • Step 8: Verify the path, and click “Next.”

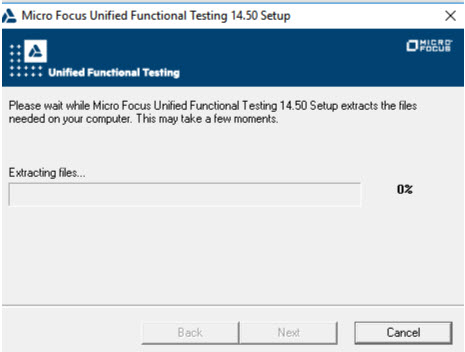
  • Step 9: Click “Next.”

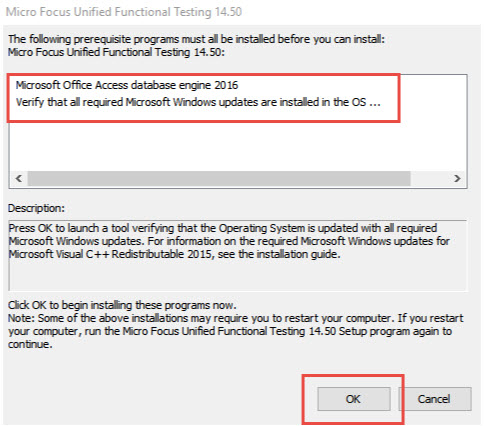
  • Step 10: Verify all of the prerequisites, and continue with installation.

  • Step 11: Click the Next button.

  • Step 12: Select “I accept the terms” in the License Agreement, and click “Next.”
  • Step 13: Select all of the add-ins, and click “Next.”


  • Step 14: Click “Next.”
  • Step 15: Click “Install.”

You can also use this PDF file for installation help.

  • Step 16: Once the installation is complete, open the tool and create the sample test.
  • Step 17: Follow this URL, and learn how to create an automated test for the Sample MyFlight application.
  • Step 18: You can use either the Calculator application from Unit 2 or the sample MyFlight application to create additional automated test cases.

You need to create at least 4–5 automation test cases using either Sample MyFlight or the Calculator application.

Submit the following in a .zip file:

  • Output screenshot of UFT installation
  • Entire solution folder that contains 4–5 automation test cases

online paper


  • Kuhn, M. (2019, March 27). The caret package. Github. https://topepo.github.io/caret/

 Outline for Assignment 1

  • Refer to the Documenting Research Guide for assistance in organizing your research and developing your outline.
  • You can find this guide in the Useful Information folder, as well.

 Using the research guide and the assignment 1 instructions, develop your outline. Submit the outline in an MS Word document file type. Utilize the standards in APA 7 for all citations or references in the outline. Ensure that the document includes your name. Do not include your student identification number. You may use the cover page from the student paper template, but it is not required.

 The assignment 1 instructions are at the bottom of this content folder.Submit your outline on or before the due date.By submitting this paper, you agree:

(1) that you are submitting your paper to be used and stored as part of the SafeAssign™ services in accordance with the Blackboard Privacy Policy;
(2) that your institution may use your paper in accordance with UC's policies; and
(3) that the use of SafeAssign will be without recourse against Blackboard Inc. and its affiliates.
Images

WEEK 5: INDEPENDENT PROJECT: EXCEL 2019 IN PRACTICE – CH 6 INDEPENDENT PROJECT 6-6


Clemenson Imaging LLC monitors increased revenue from the use of CT scan equipment. You analyze the number of patients and procedures by technician and location.

[Student Learning Outcomes 6.3, 6.4, 6.5, 6.6, 6.7]

File Needed: ClemensonImaging-06.xlsx (Available from the Start file link.)

Completed Project File Name: [your name]-ClemensonImaging-06.xlsx

Skills Covered in This Project

  • Calculate the net present value of a purchase.
  • Use TRANSPOSE to rearrange labels into a column.
  • Concatenate cells to display full names.
  • Use SUMIFS to summarize data.
  • Calculate procedure times.
  • Format times with fractions.
  1. Open the ClemensonImaging-06 workbook and click the Enable Editing button. The file will be renamed automatically to include your name.
  2. Determine the net present value of a new equipment purchase.
    1. Click the Financials sheet tab and select cell H5.
    2. Use NPV with a Rate argument of 4.25%.
    3. Select cells D7:D13 for the Value1 argument and click OK. This is the same as entering each value argument separately.
    4. Edit the formula to add both costs (cells D4 and D5) at the end of the formula. The net present value is $268,921.79.
  3. Use TRANSPOSE and CONCAT to display technician names.
    1. Click the Technicians sheet tab. The names are in rows.
    2. Select cells A4:A10, seven rows in one column.
    3. Select TRANSPOSE from the Lookup & Reference category and select cells A1:G1 for the Array argument.
    4. Press Ctrl+Shift+Enter to complete the array formula.
    5. Repeat the TRANSPOSE task for the first names in cells B4:B10.
    6. Select cell D4 and create a CONCAT formula to display the name in first name, last name order (Figure 6-111).ImagesFigure 6-111 CONCAT formula to display names
    7. Copy the formula in cell D4 to cells D5:D10.
    8. Click the Summary sheet tab, select cell A5, and create a 3D reference to cell D4 on the Technicians sheet.
    9. Copy the formula and preserve the borders.ImagesFigure 6-112 SUMIFS with absolute and relative references
      ImagesFigure 6-113 Change time format to display fractions
  4. Use SUMIFS to total number of patients by procedure and technician.
    1. Click the Summary sheet tab and select cell C5.
    2. Use the SUMIFS function with an absolute reference to cells $D$5:$D$41 on the Procedures sheet as the Sum_range argument.
      • The Criteria_range1 argument is an absolute reference to the image type column on the Procedures sheet, cells $E$5:$E$41.
      • The Criteria1 argument is a relative reference to cell B5 on the Summary sheet.
      • The Criteria_range2 argument is an absolute reference to the technician names column on the Procedures sheet.
    3. Select cell A5 for the Criteria2 argument (Figure 6-112).
    4. Copy the formula in cell C5 to cells C6:C11 and preserve the borders.
  5. Use SUMIFS to total number of patients by category and location in cells C14:C15.
  6. Look for and correct format inconsistencies.
  7. Calculate procedure times.
    1. Click the Times sheet tab and select cell F6.
    2. Build a formula to subtract the start time from the end time and multiply those results by 24. The result is shown in hours.
    3. Copy the formula to row 41.
    4. Select cells F6:F41 and open the Format Cells dialog box. On the Number tab, choose Fraction with a Type of Up to two digits (Figure 6-113).
  8. Save and close the workbook (Figure 6-114).
  9. Upload and save your project file.
  10. Submit project for grading.

Order # 10265

Title: ics (human factors web) homework -2800

Paper type Coursework

Paper format MLA

Course level High School

Subject Area Other (Not listed)

# pages 3   ( or 900 words Minimum)

Spacing Double Spacing

# sources 0

Paper Details

Assignment #5 – group project continued

You will continue this assignment with the same group you worked with on the last assignment.

If you have any major problems or issues in your group, please contact the instructor ASAP.

Overview of Assignment 5 and Assignment 6

For this assignment and the next one, you will continue the (re)design of the web site you chose in the last assignment. This (re)design process will span both assignments. Here is an overview of the entire process:

Assignment 5: Decide on what aspect(s) of your site you will (re)design, and build a prototype – this should be based on usability issues you found in Assignment # 4.

Assignment 6: Run user tests on your (re)design, refine the design based on the tests, build a new prototype, and run another set of user tests.

Assignment 5 Instructions

Step 1: Decide on what aspect(s) of your site you will (re)design. You will probably consider some combination of page design and navigation. Thinking in terms of user tasks, you should probably focus on a task or combination of tasks that should ideally take the user from three to five minutes; that’s long enough to be interesting but short enough to make creating the prototype and running the user tests manageable. If you have concerns over whether the aspects you have chosen are “enough” (or too much), send a message to the TAs or instructor or use Piazza.

Step 2: Sketch a number of possible re-designs on paper. Each person in your group should do at least 3 different sketches (on paper) for possible (re)designs of your site. These can be either visual (layout) or process (flow through the task) kinds of sketches. Use your HCI notebooks for inspiration. You should do these separately, and then compare your ideas. Think of this as visual brainstorming. Choose one sketch that will be the basis for the (re)design, or create a new composite sketch that gives a quick sense of what your (re)design will be.

Step 3: Using a prototyping tool of your choice (e.g., Balsamiq, Moqups, etc.), create a prototype of your (re)design. Your prototype should include all the alternative clicks/entries/actions/displays that the user may see or need while working through the task(s) (from Step 1) using the prototype.

Deliverables:

Include your Assignment #4 with Assignment #5. Consider it the same document for Assignments #4, #5 and #6 – essentially a design and evaluation report that you might create if you were doing this in a company. As such, consider a table of contents and/or good headings to make it clear what the different sections of the document are. See the section below for more on writing design reports. (overall form, layout, design of the document: 5 points)

Part A (10 points)

(about 200-300 words)

A description of the aspect of your site you decided to (re)design in Step 1 (3 points)

A detailed description of the task(s) you expect the user to be able to carry out in your prototype (7 points)

Part B (30 points)

The sketches that you produced in Step 2. Use a scanner or camera to capture the paper sketches, and paste into your document. These don’t need to be great quality, just good enough to read. Make sure the team member’s name is on the sketches she or he created. You should have a minimum of 9 sketches (3 per person). Also indicate/include the “final” sketch that was the basis for your prototype. (approximately 3 points for each sketch plus 3 extra points for the “final” sketch)

Part C (25 points)

Your prototype (all pages) from Step 3.

Part D (15 points)

(about 300-400 words)

A brief description of how your prototype works. If it is a redesign, what is different from the original? (5 points)

What issues were you trying to address in the design? (5 points)

How does your design represent the users/stakeholders you described in Assignment 4? (5 points)

Submit these materials as PDF(s) via Canvas. Make sure the document(s) include your team name and all the names of all your group members on first page of document (name the file “Lastname1_Lastname2_Lastname3_ICS4_HW5”)

A Note on Prototypes

Your prototype needs to be detailed enough that we are able to use them for usability testing in Assignment #6. That means that simple black-and-white wireframes that show layout but no content are probably not detailed enough. On the other hand, a fully realized web page is more detail than you need. Your prototypes should be somewhere in the middle.

These videos shows usability tests using paper prototypes. They offer a good sense of how detailed a prototype should be:

http://youtu.be/9wQkLthhHKA?t=1m20s

http://youtu.be/ppnRQD06ggY?t=98 (not great quality on this one, but enough to see what’s going on)

One caveat about the level of detail: if you are making a claim that more color, better imagery, better alignment, etc. will produce a better user experience with your site, you will need to provide more detail about those aspects, enough that we are able to recognize and evaluate the claims. In other words, the more important the feature is to your overall design, the more detail you will need to provide.

Writing Design/Evaluation Reports

A design report is a document that summarizes what you did on a design project. It is often used in organizations as a way to document the process and decisions made during a design project. In this class, Assignments #4, #5, and #6 together will form the meat of the design report (the complete report will be your deliverable for Assignment #6). There are many different formats for design reports, and many organizations have more formal processes for creating them, but they have a similar generic structure with three main sections:

Section 1: Describe the problem and background for the project. In a user-centered design project, this will include a lot of information about the stakeholders of the system. This section corresponds to Assignment #4.

Section 2: Describe the design itself and the process through which it was developed. This section corresponds to Assignment #5.

Section 3: Describe the evaluation of the design and any resulting changes. This section corresponds to Assignment #6.

You may also have additional sections including a title page, table of contents, or executive summary at the front, and lists of references, illustrations or appendices at the end.

For a nice guide to writing design reports, check out http://www.me.umn.edu/education/undergraduate/writing/How-to-write-a-Design-Report.pdf. It comes out of a mechanical engineering discipline, but is mostly applicable here. The style of report they describe is more detailed and slightly different from what we’ll be doing (e.g. their prototype description is in the evaluation section, whereas we have it in the design section), but overall it is a good overview.

attachment:

https://drive.google.com/drive/folders/1pSM7wxUr6cZd1FJzQGq-BfVTLgA7zDt2?usp=sharing